The evolution of inflation expectations is an important factor that affects the monetary policy decisions of central banks and is also shaped by these policy decisions. Indeed, economic actors also take inflation expectations into account in their investment, consumption and pricing decisions. Therefore, central banks that can manage inflation expectations can enhance the effectiveness of monetary policy.[1] In this context, the Central Bank of the Republic of Türkiye (CBRT) has started to publish the Sectoral Inflation Expectations, consolidating the 12-month-ahead inflation expectations of a range of economic actors. This blog post examines the methodology of the Sectoral Inflation Expectations publication as well as the inflation expectations shared with the public.
Inflation expectations of different sectors are currently compiled from three different surveys.[2] The CBRT conducts the Survey of Market Participants (SMP) to gather the 12-month ahead inflation expectations of decision-makers and experts in the financial and real sectors, and the Business Tendency Survey (BTS) to gather the 12-month-ahead inflation expectations of manufacturing industry firms. Additionally, in collaboration with the Turkish Statistical Institute (TURKSTAT), the CBRT conducts the Consumer Tendency Survey (CTS) to monitor the 12-month-ahead inflation expectations of households. With the publication of the Sectoral Inflation Expectations, expectations of the real sector and households will also be shared with the public on a regular basis, together with the expectations compiled from the SMP.
When calculating the inflation expectation of the real sector, extreme values were eliminated using the Tukey’s Hinges[3] method. Household inflation expectations under the CTS were also generated via a similar method, but additional consistency checks were applied due to the high variation in household responses.
For further explanation, we should first list the CTS questions asked to households about inflation:
- How do you think that consumer prices have developed over the last 12 months?[4]
- By how many percent do you think that consumer prices have gone up/down over the past 12 months? (Please give a single figure estimate).
- By comparison with the past 12 months, how do you expect that consumer prices will develop in the next 12 months?[5]
- By how many percent do you expect consumer prices to go up/down in the next 12 months? (Please give a single figure estimate).
To be able to make a correct assessment of the statistics produced from households, the CBRT examined the consistency between the responses of consumers to the questions related to the perceived inflation rate, expectation of the trend for the period ahead and the expected inflation rate. Responses that showed inconsistency were excluded from the calculation. After the consistency check, extreme values were eliminated using Tukey's Hinges method for outlier analyses to obtain the average inflation expectation of households.
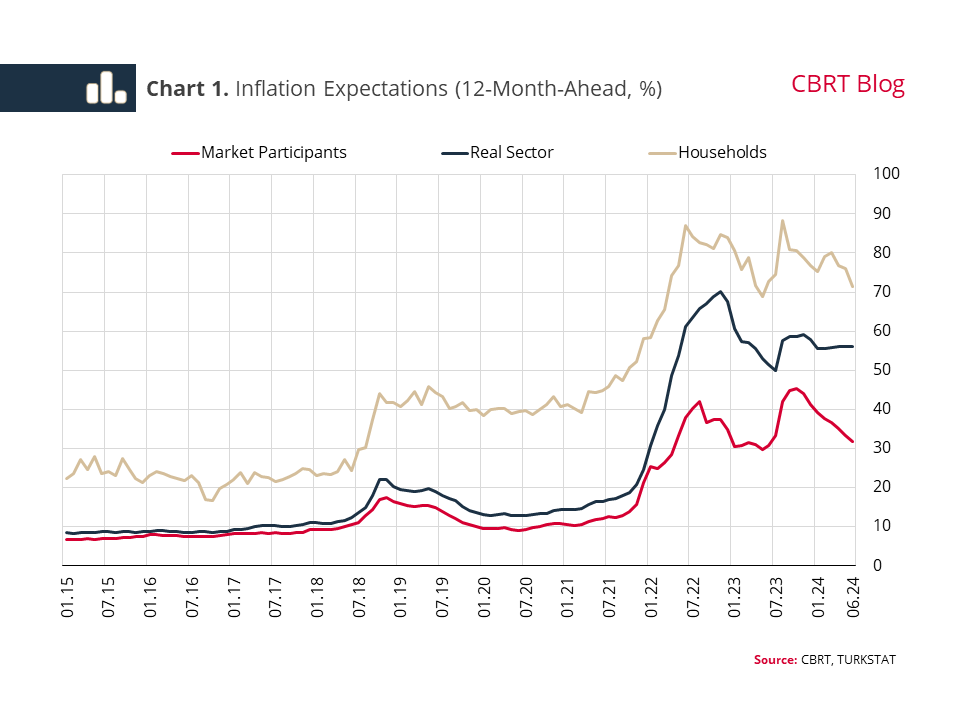
The annual inflation expectations of households, the real sector and market participants for the next 12 months obtained using this method are given in Chart 1 as a time series. First, it is noteworthy that households have the highest inflation expectations over time, while market participants have the lowest. This is consistent with international findings showing that inflation expectations of households are generally higher than other groups.[6] An analysis of trends reveals that household inflation expectations have increased since 2015, the beginning of the calculation of data, and peaked in August 2023. After this date, these expectations showed fluctuations and declined to 71.5% in June 2024. The real sector’s inflation expectation, which is less volatile and lower than that of households, increased significantly from the last quarter of 2021, reaching its highest level towards end-2022, and remained flat around 55% in the January-June 2024 period. Meanwhile, market participants' expectations, which had peaked at 45.3% in October 2023, declined steadily in the following period and stood at 31.8% as of June 2024. Although the levels of the three sectors’ 12-month-ahead inflation expectations differ, the recent downtrend in expectations is similar. The CBRT’s decisive stance in monetary policy is expected to sustain the improvement in inflation expectations.
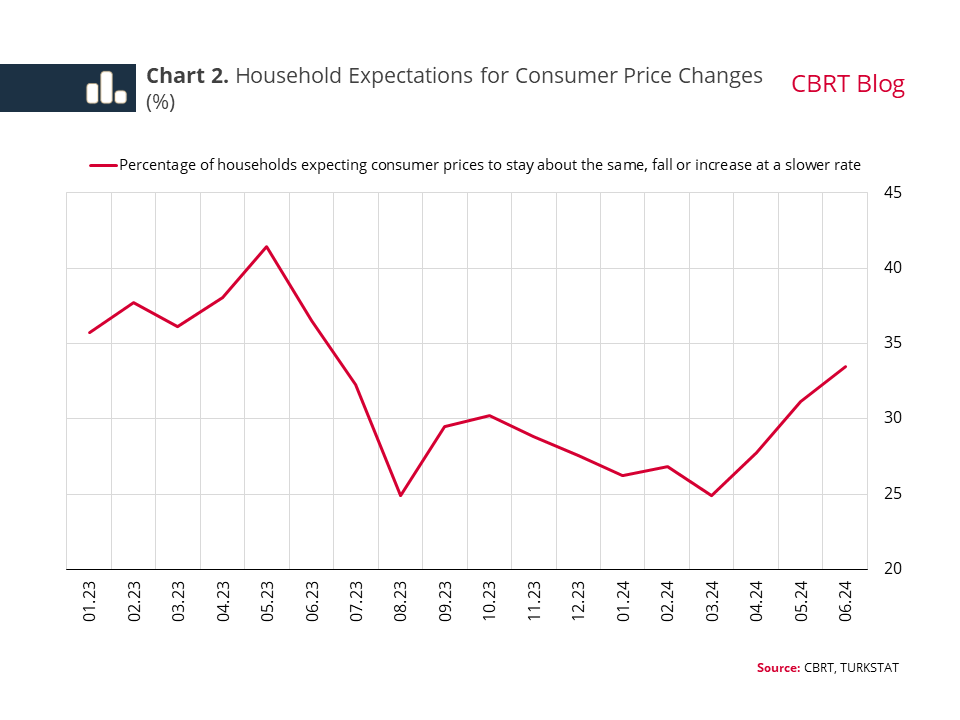
The level of headline inflation is known to be an important factor in households' future inflation expectations. It is thus critical to monitor household expectations for the direction of inflation as well as the level of inflation. To this end, the Sectoral Inflation Expectations also presents the directional trend of households' inflation expectations for the 12 months ahead. Chart 2 displays the change in the share of households expecting inflation to fall over time. The share of those expecting a fall in inflation has been rising significantly since March 2024, reaching 33.5% in June 2024. This rate is expected to increase further with the anchoring of inflation expectations.
[1] For the importance of inflation expectations in monetary policy, see Bernanke (2013).
[2] For detailed information on the surveys, see the metadata for SMP, BTS and CTS.
[3] Tukey’s Hinges Method
- First Quartile (Q1): Represents the lowest 25% of the data.
- Third Quartile (Q3): Represents the highest 25% of the data.
- Interquartile Range (IQR): Represents the difference between Q1 and Q3. (IQR=Q3-Q1)
Outliers are identified as the values outside the Q1–3*IQR and Q3+3*IQR range, and are excluded from the analysis.
[4] For the question about perceived inflation, survey participants can choose from the following options: “risen a lot”, “risen moderately”, “risen slightly”, “stayed about the same”, “fallen”, “I do not know”, and “I do not want to respond”.
[5] For the question about expected inflation, survey participants can choose from the following options: “increase more rapidly”, “increase at the same rate”, “increase at a slower rate”, “stay about the same”, “fall”, “I do not know” , and “I do not want to respond”.
[6] For the gap between expectations, see Kmetz, Shapiro and Wilson (2022).